Equivalence classes and their many uses in RNA-seq analyses
If you’re performing an RNA-seq experiment, there’s a good chance that aligning to the genome will be one of the key steps in your workflow. The mapping locations of your reads will likely form the basis for a range of downstream analyses, such as differential expression and fusion detection. Alignment has some downsides though—it is fairly computationally intensive, and our alignment is only going to be as good as the reference genome allows. If you’re interested in unusual variants that don’t gel nicely with the reference genome, it may end up being a source of bias.
Recently, the concept of pseudo-alignment has become popular in the RNA-seq world, chiefly through the tools of Salmon and kallisto. These methods allow ultra-fast quantification of transcripts without performing traditional genome alignment. Because these methods don’t care exactly where the read aligns, only whether it can be counted as belonging to a certain transcript, they are super fast, but can be a little harder to understand conceptually. Pseudo-aligners first create a de bruijn graph index constructed from k-mers1 of a given reference transcriptome, and then map a given read’s k-mers onto this index. Equivalence classes, also called transcript compatibility classes, are inferred by checking which transcripts overlap a given read’s k-mer path. Each unique combination of transcripts is a different equivalence class. From this point, pseudo-aligners use probabilistic inference to estimate transcript abundance from read counts that correspond to equivalence classes. I’m going to ignore this process and talk just about how we can use equivalence classes for two disparate use cases: improving differential transcript usage and detecting novel RNA variants. If you’d like more info about exactly how a pseudo-aligner such as kallisto works, I’d recommend this blog post.
The equivalence class (EC) is a mathematical concept where elements in a set are said to be in the same equivalence class if they share an ‘equivalence relation’, which could be anything. For example if the equivalence relation is ‘the same colour as’, then elements a and b are in the same equivalence class if they share the same colour. In the transcriptomics context, we are primarily interested in shared sequence. Here we define an EC as a set of transcripts a given read is compatible with; hence reads a and b are in the same equivalence class if the are compatible with the same set of transcripts. While the concept has been previously applied to transcriptomics, it has been made particularly useful since the inception of pseudo-aligners. We can best illustrate ECs in a diagram; in the figure below (Figure 1a from our paper) we have three transcripts and four ECs. Reads aligning to the green area come from exons 1 or 2, and could correspond to any of the three transcripts shown. Thus our EC consists of t1, t2 and t3. Reads aligning to the yellow area however, could only come from transcripts t1 or t2, forming that equivalence class. The other ECs are defined similarly. In this example, not all possible ECs exist in the data. For example, there is no equivalence class that corresponds only to t2, however a read that spans the exon junction between Ex4 and Ex5 would be assigned to the EC defined by t2.
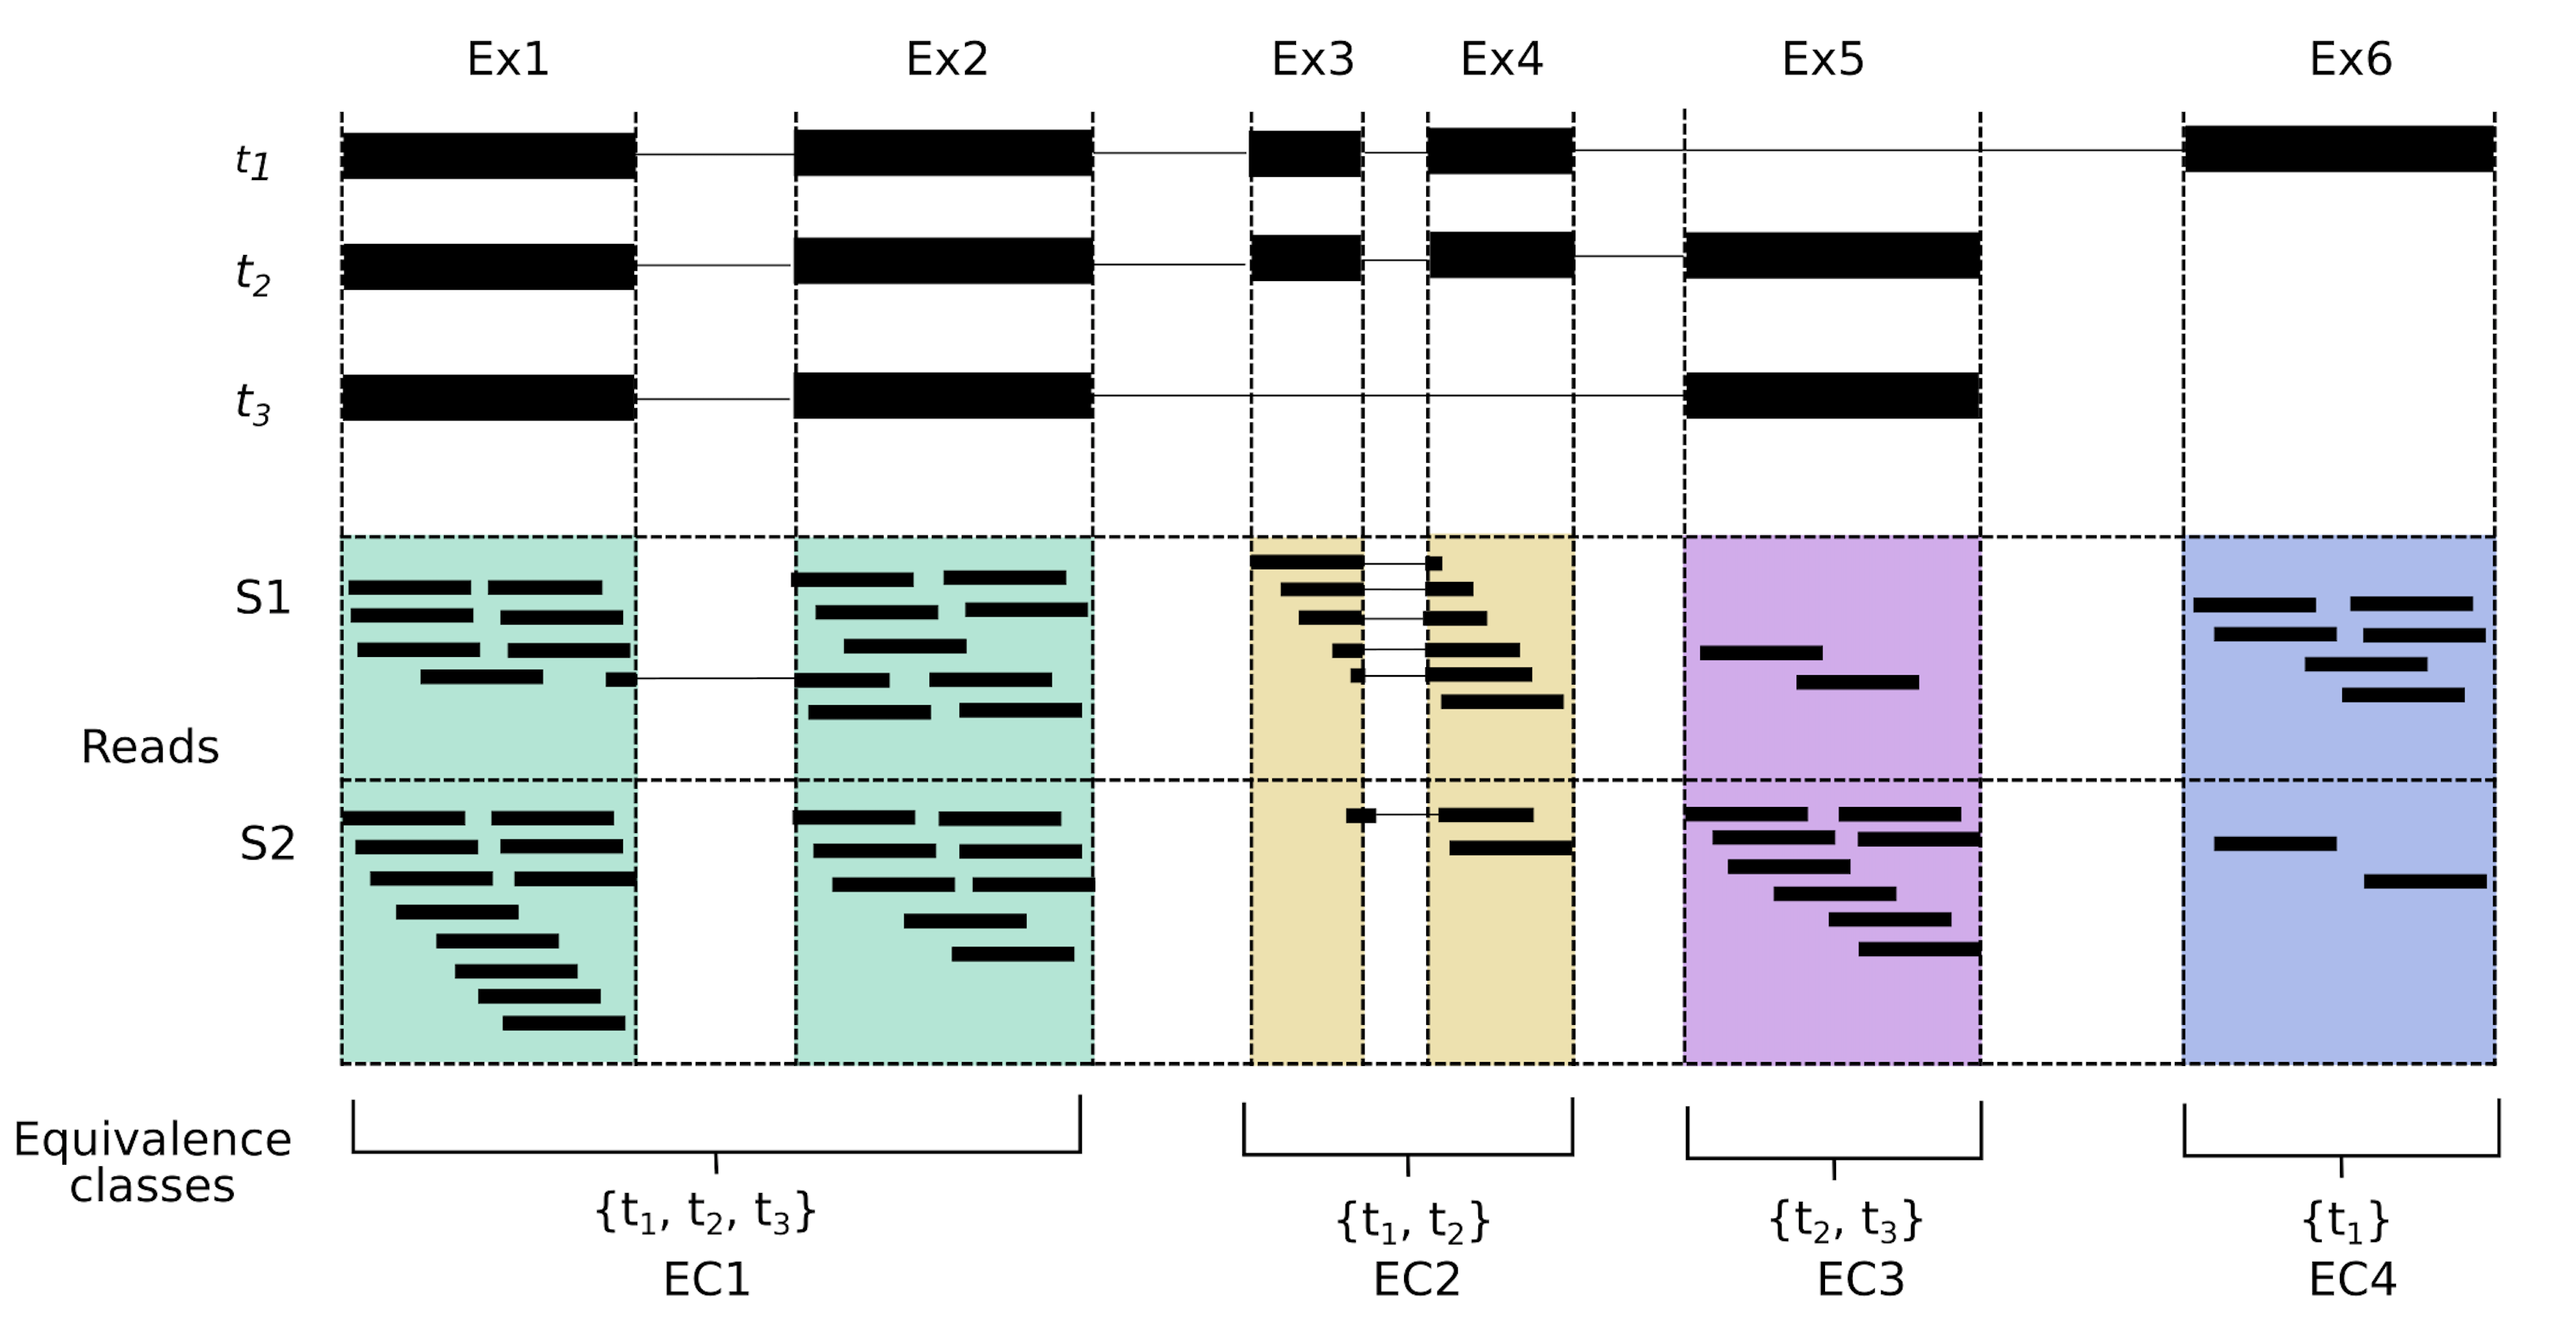
I’m showing genome-style alignments here, but I should note that our pseudo-aligner doesn’t see the reads as above. Our pseudo-aligner has no knowledge of introns or exons, all it knows is the transcript sequences of t1-t3, which it uses to make the index. We won’t know exactly where the read aligns, or if it aligns across any junction boundary, as we can see for one of the reads in EC1 and several reads in EC2. We just know that a read in the green area (EC1) belongs to either transcript 1, 2 or 3, but we can’t be sure which transcript it originated from. A key feature of ECs is that they are exact. One read can be assigned to one equivalence class, whereas assigning a read to one exon or one transcript is, potentially, far more ambiguous. This is what makes ECs a nice unit for quantification.
In our paper, we proposed using equivalence classes as the read counting unit on which to base our analysis of differential transcript usage, or DTU. DTU involves identifying differences in the relative proportion of transcripts expressed between conditions. The RATS paper has a nice explanation the different transcript analyses, such as differential gene expression (DGE), differential transcript expression (DTE) and DTU (see Figure 1).
This figure below gives us the main crux of our paper, we see the performance of the EC DTU method on two simulated data sets, drosophila and human, where each point shows the true positive rate, and false discovery rate at three FDR cutoffs, so being closer to the top left is better.
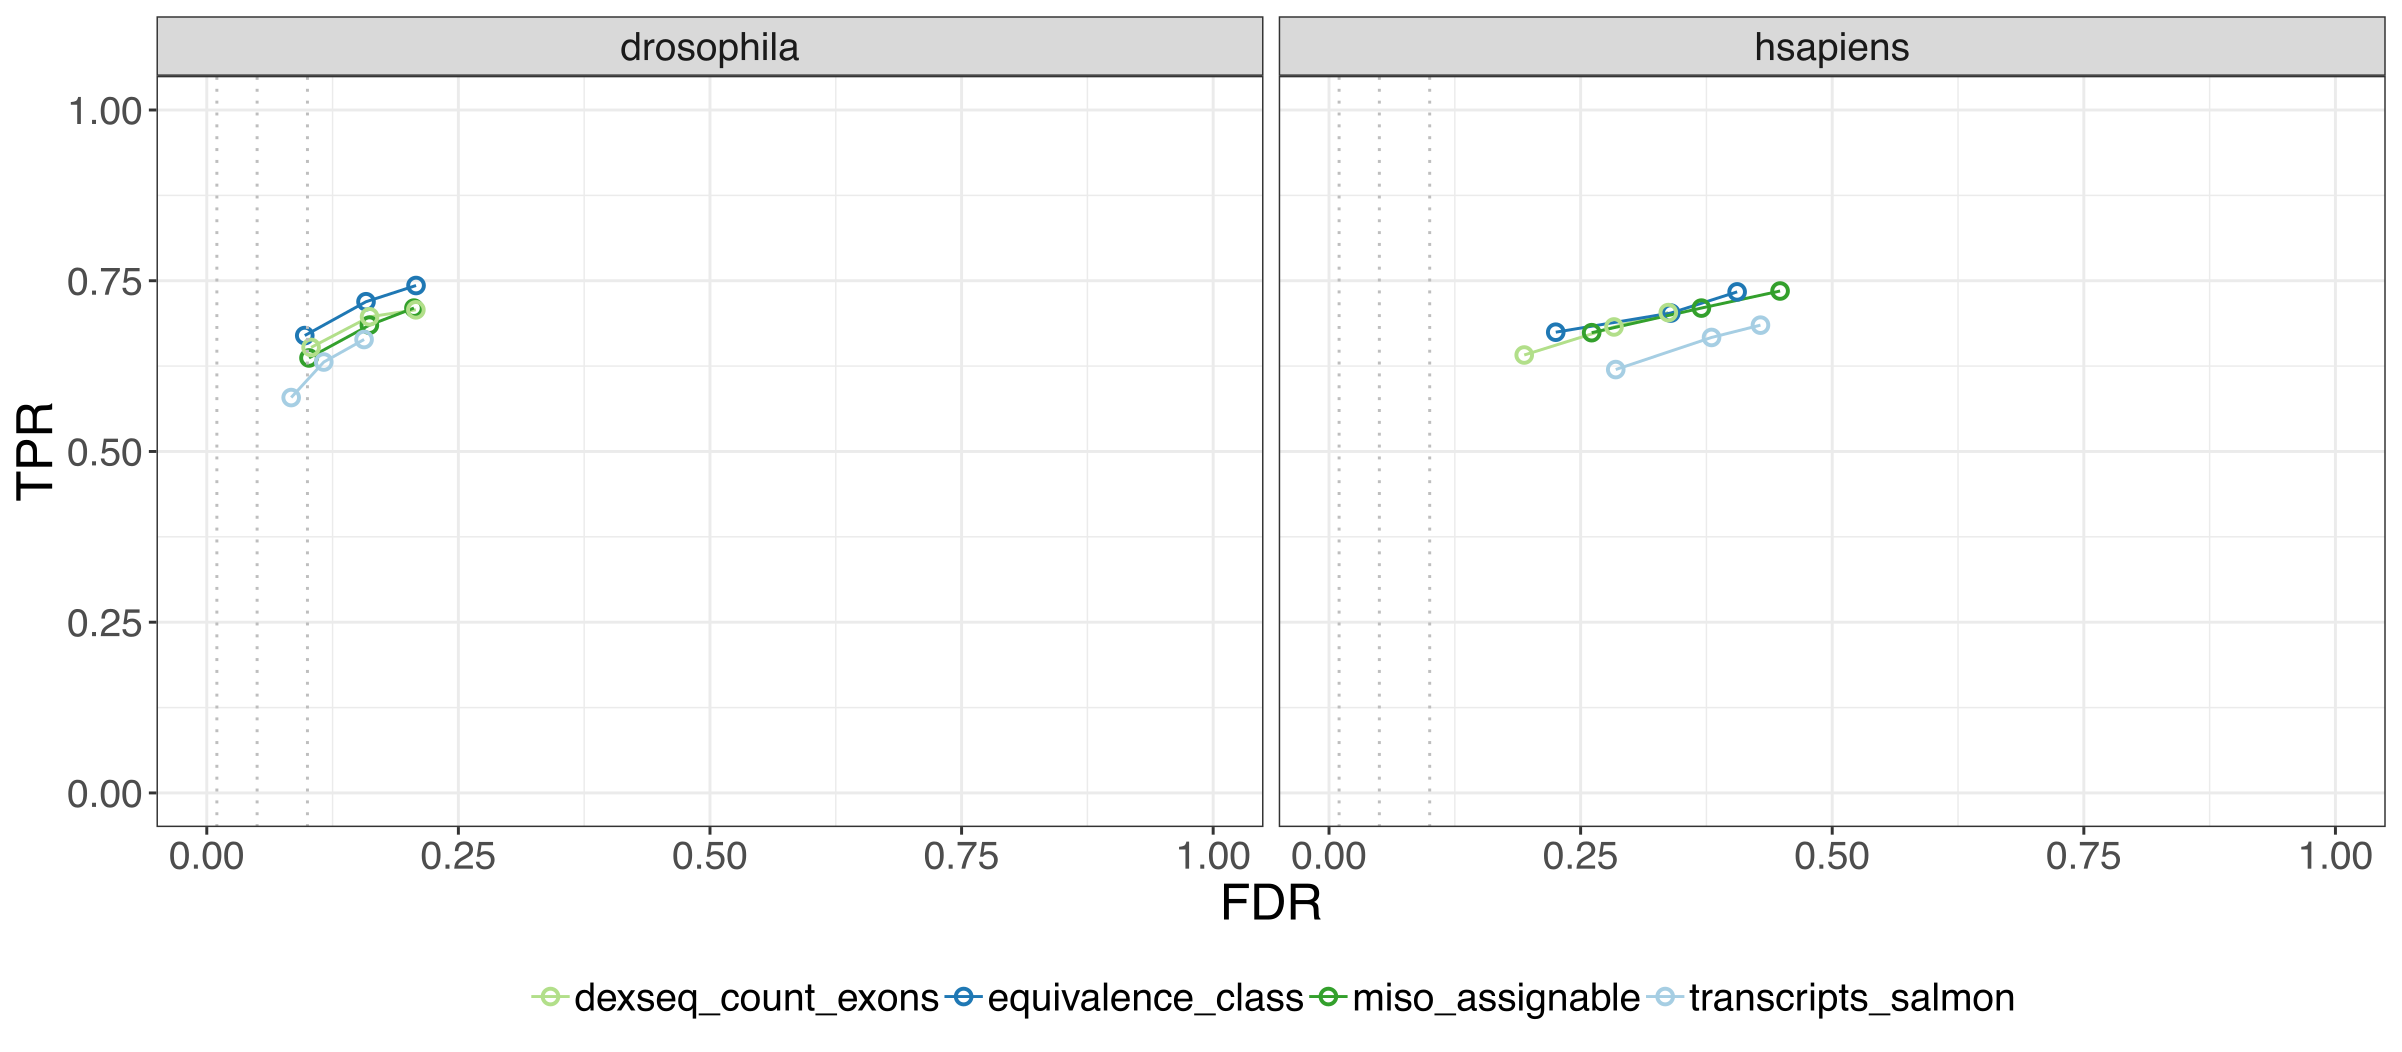
We found that EC DTU analysis outperforms transcript-level DTU, and performs on par with exon-based methods, which are far more computationally expensive.
While using ECs ends up being efficient, fast and accurate, it does present some problems with downstream interpretation. As a single EC often corresponds to multiple isoforms, it can be tricky to determine which transcript is actually differentially used.
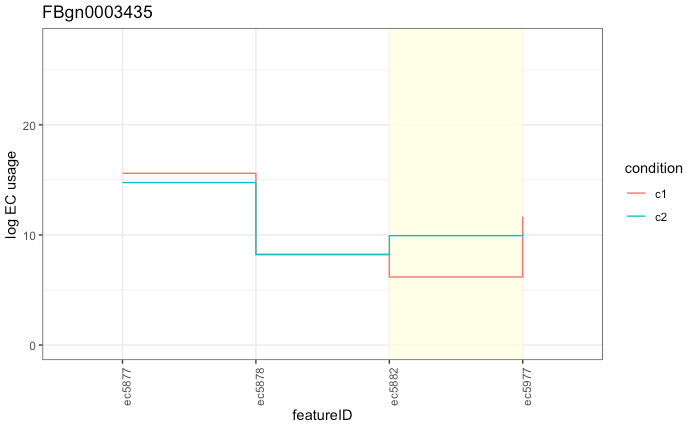
Can you tell which transcript is differentially used? Of course, it’s not obvious unless you happen to know exactly which transcript(s) belong to ec5882. In this case, it happens to be a single transcript, but it could be a lot more complex with several significant ECs with several transcripts within each given EC. Improving interpretation and visualisation in this space is still an open research question.
Now, let’s say we wanted to perform DTU, but the gene that we’re interested in has a set of transcripts that don’t exist yet in the reference transcriptome. In this case, we could assemble our own version of the transcriptome using our sample’s RNA-seq reads using de novo assembly. Using our example set of isoforms, let’s say that we have an extra transcript, n4, present in sample S1. This transcript has an extended exon not found in the reference transcriptome, and thus will be invisible to pseudo aligners when a standard reference is used to build the index. To get around this, we’ll have to perform de novo assembly and add the assembled sequences to our existing reference. Anything that we assemble that matches the reference should also have an equivalence class with reference transcripts in it. An equivalence class with only a de novo transcript, however, should indicate novel sequence. If we look at transcript n4, while its transcript has membership in other ECs, it also has its own unique EC (EC5), corresponding to novel sequence.
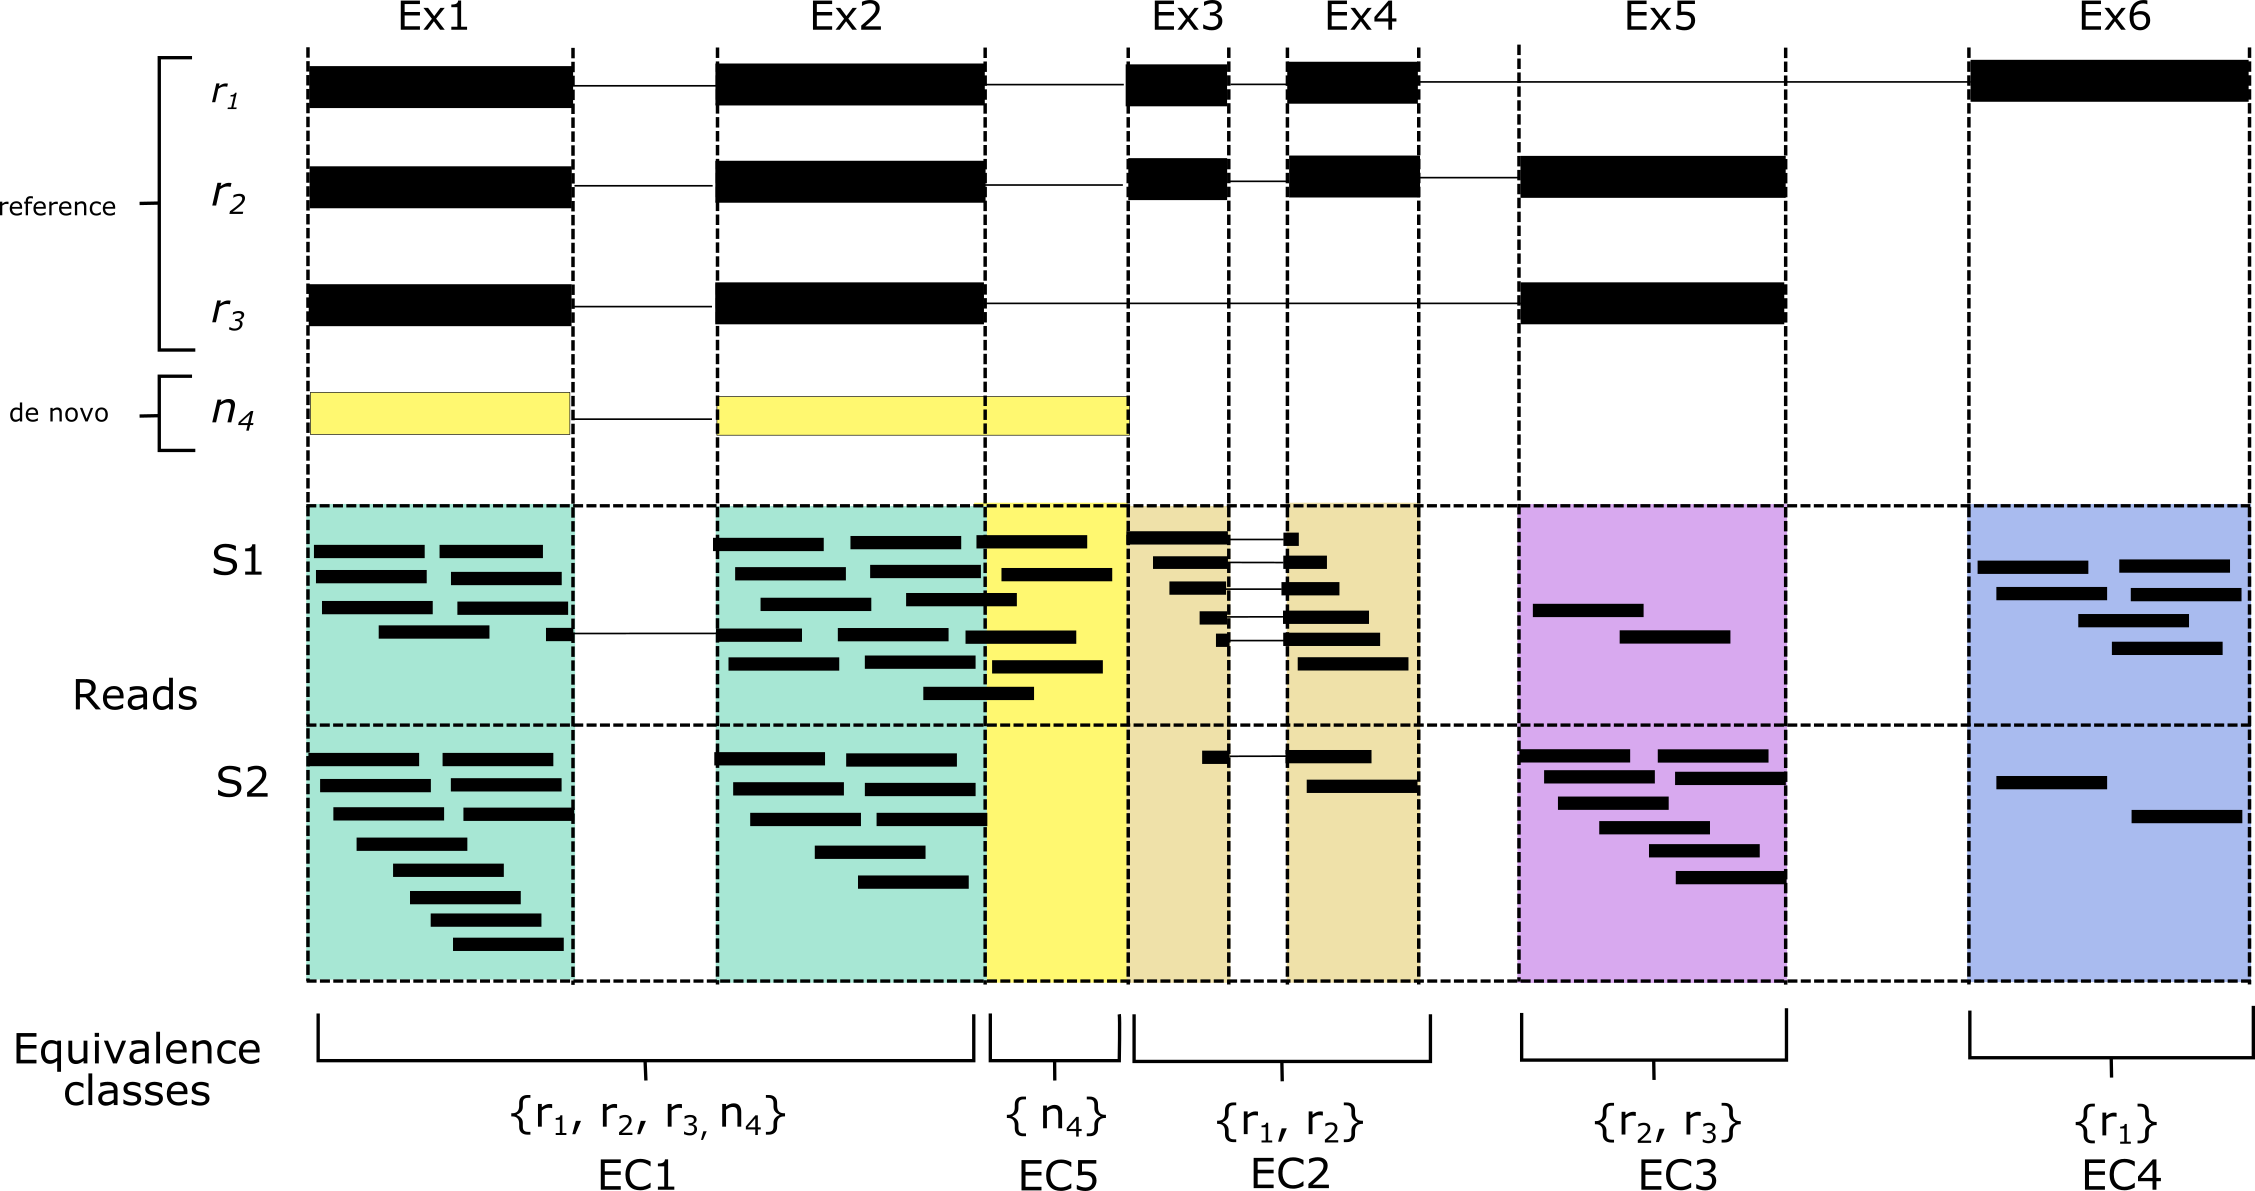
De novo assembly is noisy however, and we would expect many such unique ECs to be the result of poor assembly. One strategy to address this is through the use of controls. By counting the reads corresponding to these novel ECs and comparing them to a control (for the n4 example, we can see that sample S2 has no counts in EC5), we can be more confident that the sequence is novel and has read support that is significantly higher than in a set of control samples. The extra bonus with this strategy is that it allows identification of up-regulated novel transcripts. This is especially handy in paediatric leukaemias for example, which are often driven by an RNA driver variant that is highly expressed.
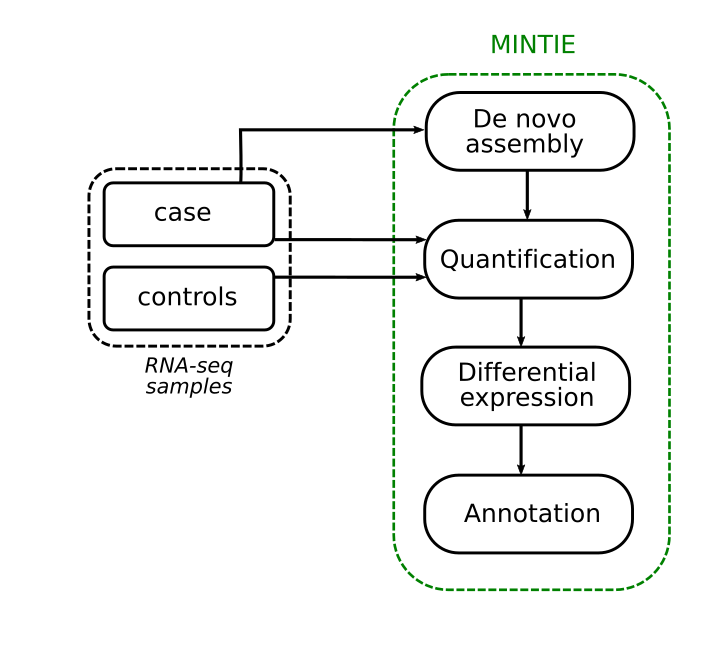
We developed this concept into an integrated pipeline called MINTIE. Here we perform de novo assembly of a case sample, identify the unique non-reference ECs using pseudo alignment and quantify them. Then we perform differential expression against a set of controls. We finally take those assembled transcripts with novel ECs, and annotate them via alignment to the genome.
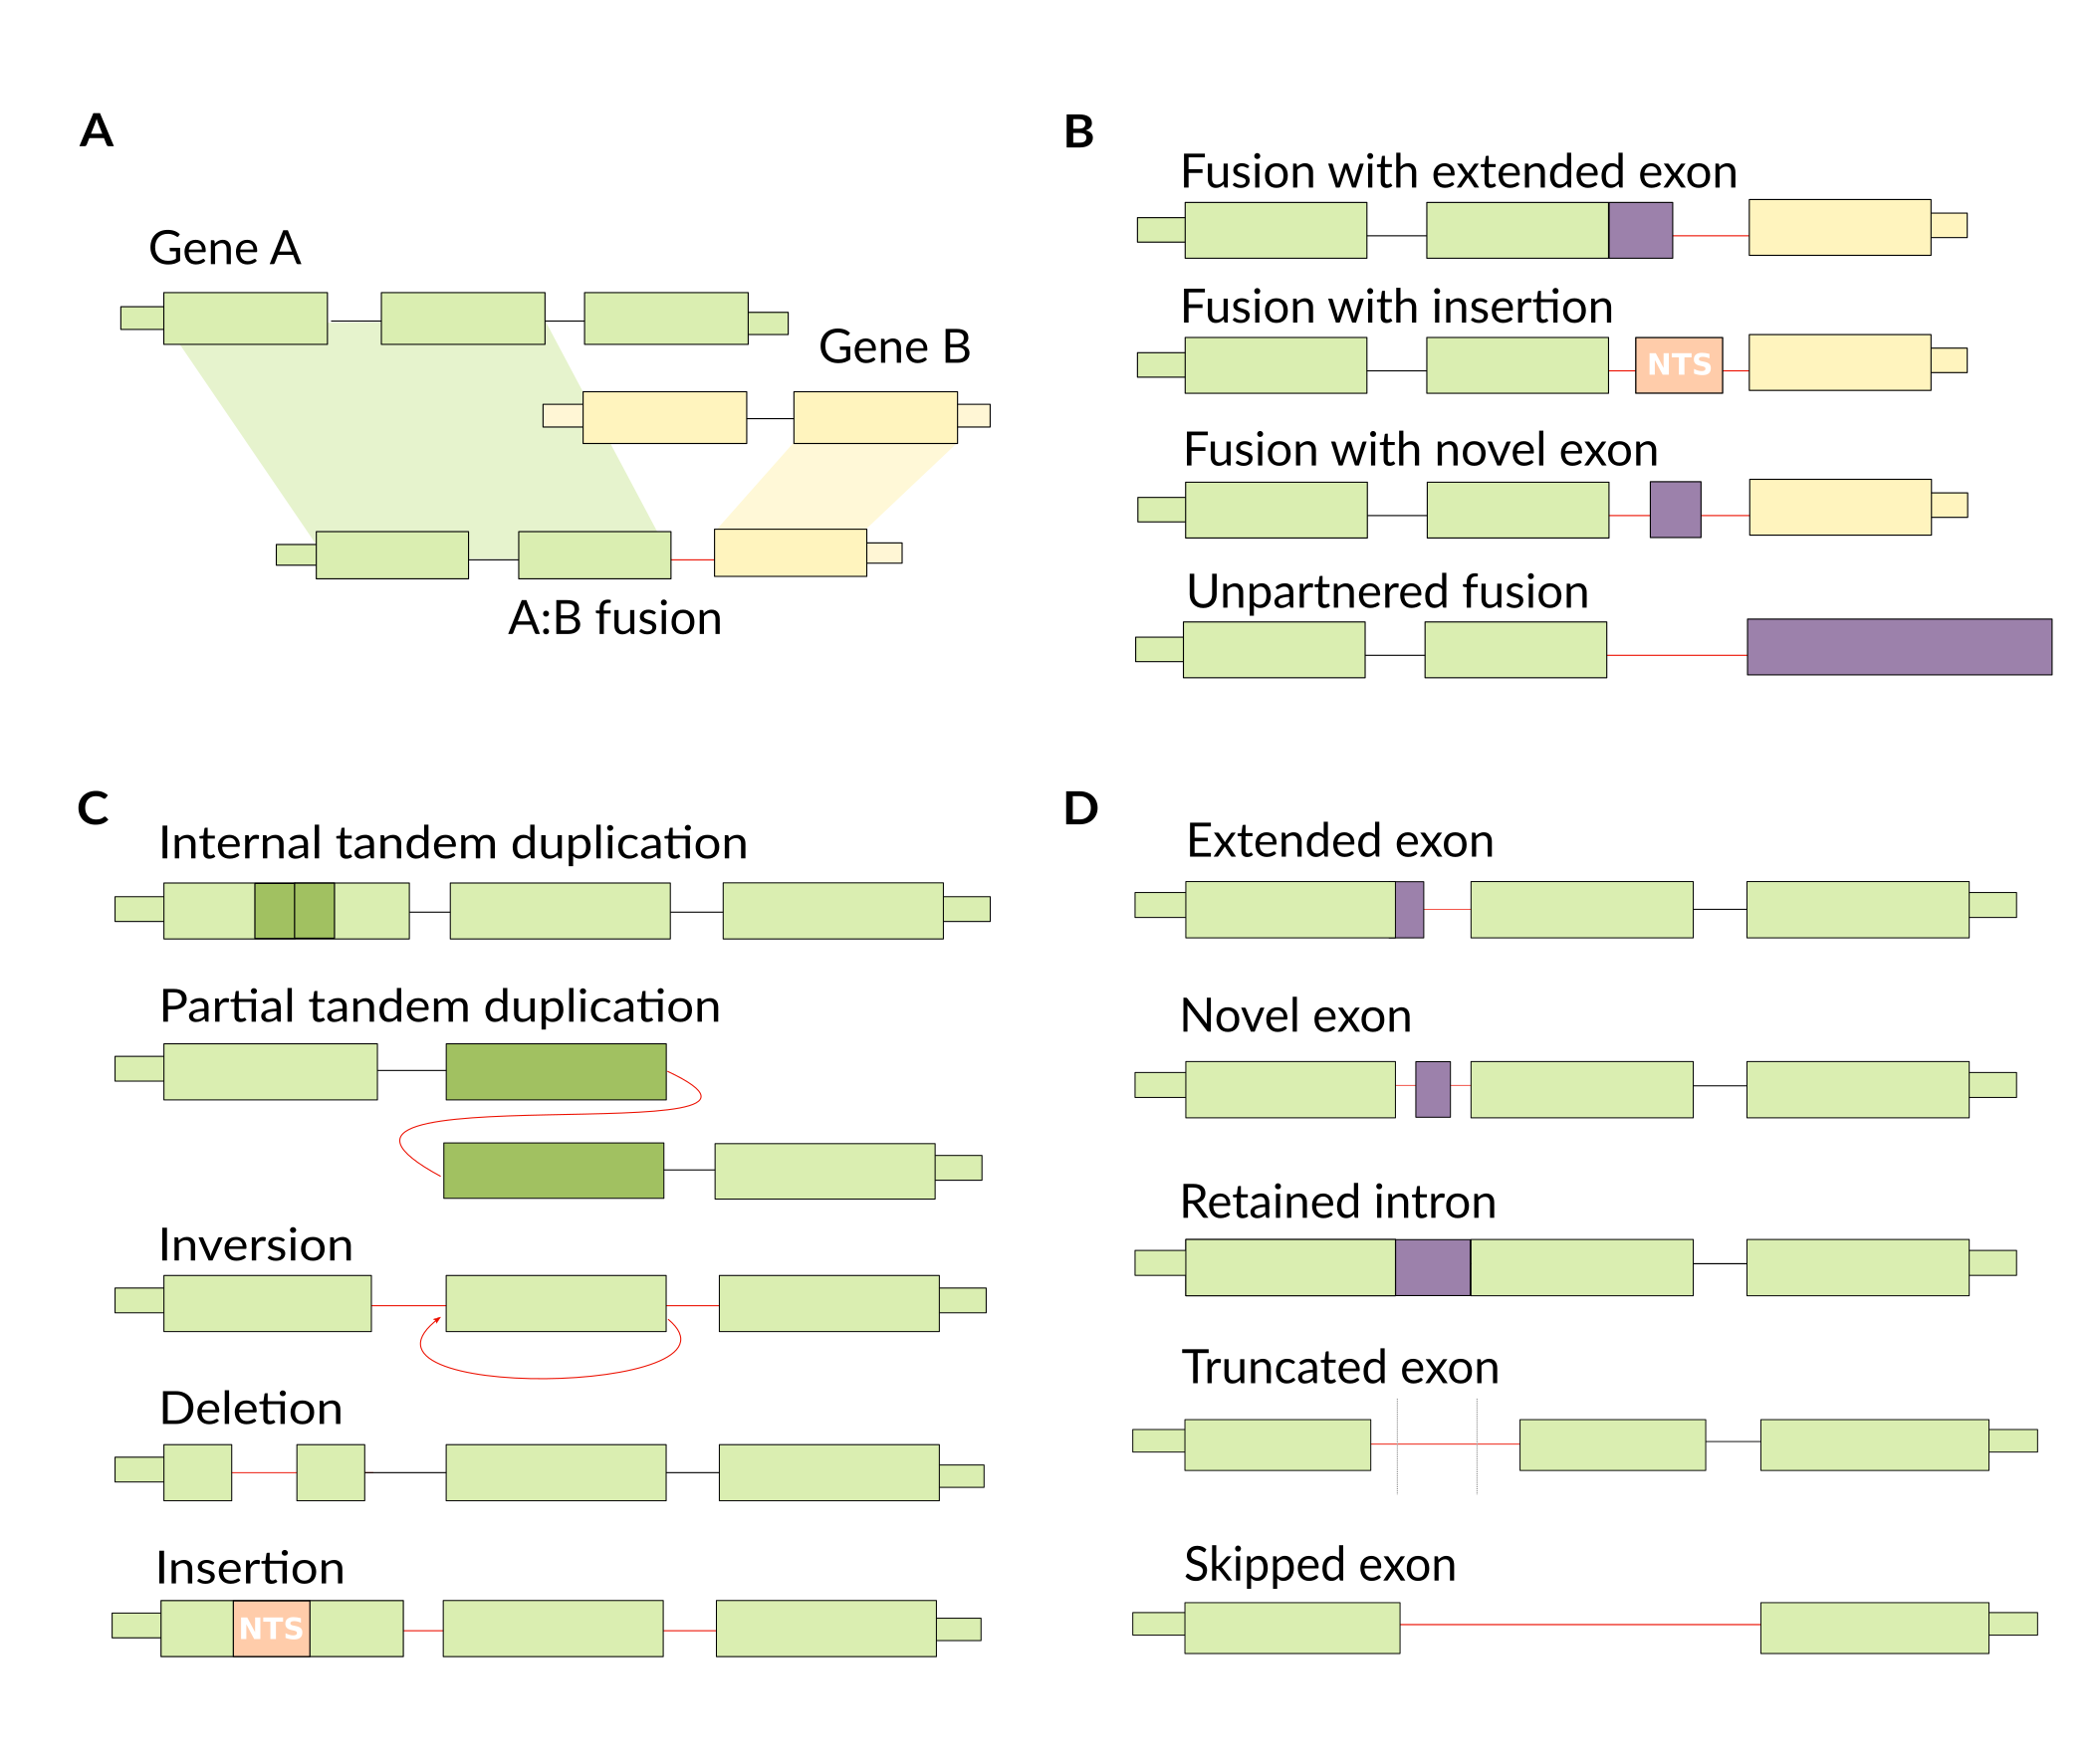
We’re not limited by the types of variants that we can detect, making this a relatively unbiased approach. We do need to make sense of the output though, as RNA-seq assembly can be noisy and will assemble lots of transcripts. So, we define a number of classes of variant types that we might see when we take this unbiased approach.
We performed validation in a few ways, first we performed simulations of the above categories and checked MINTIE’s recall. We also looked at MINTIE’s background variant detection rate (in normal samples where we expect few variants of interest), as well as the method’s performance with different numbers of controls, coverage and variant size. Check out the preprint for more of these details.
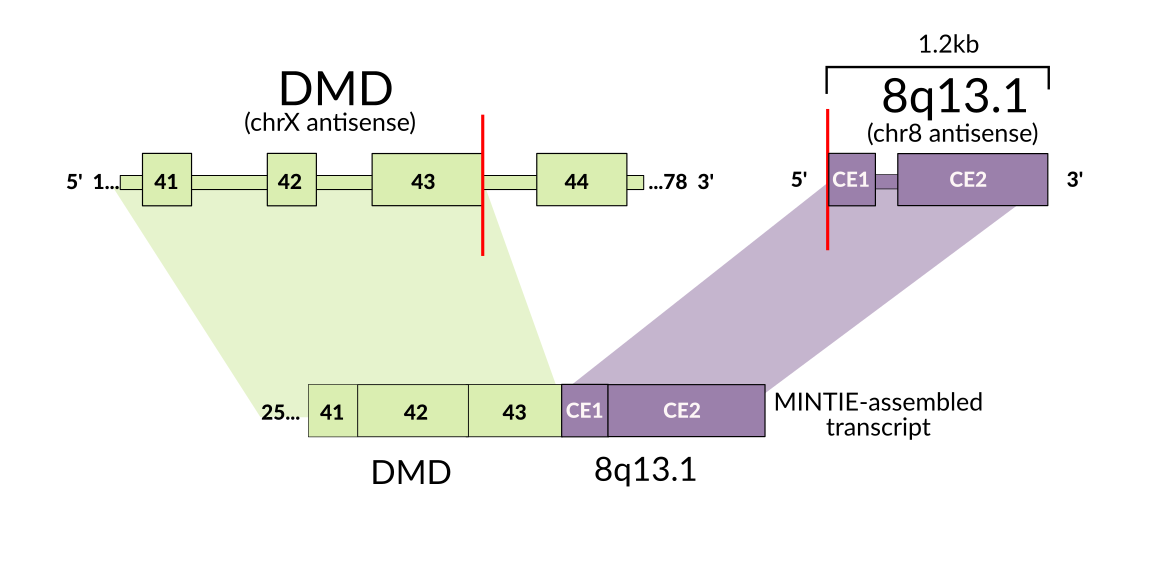
As this method is more agnostic to the structure of the novel transcript, we were able to detect several interesting variants, such as an RB1 unpartnered fusion, ETV6 splice variants and a PAX5 partial tandem duplication in a cohort of paediatric B-cell acute lymphoblastic leukaemia samples. While we developed the approach initially for use in cancer, particularly paediatric leukaemias, the approach is flexible enough to apply to rare disease. We were able to find evidence for a structural rearrangement affecting the muscle-disease associated gene DMD. As this variant creates an RNA transcript with a ‘fusion partner’ that is an intergenic region, such variants are often missed by fusion callers.
Equivalence classes are a handy concept when we’re talking about transcript isoforms, given their propensity to share exons. There’s also other research utilising this concept for other interesting use cases, such as improving gene level differential expression, performing differential expression on de novo assembled transcriptomes and clustering single cell data. I anticipate that there will be more interesting research using this concept in the future.
Thanks to Alicia Oshlack and Nadia Davidson for helpful feedback and suggestions on this post.
-
a k-mer is a substring of sequence, of length k; e.g. AT is a 2-mer, ATG is a 3-mer, etc. ↩